360 guide analytics
Know which 360 Guest Guides create serious booking intent.
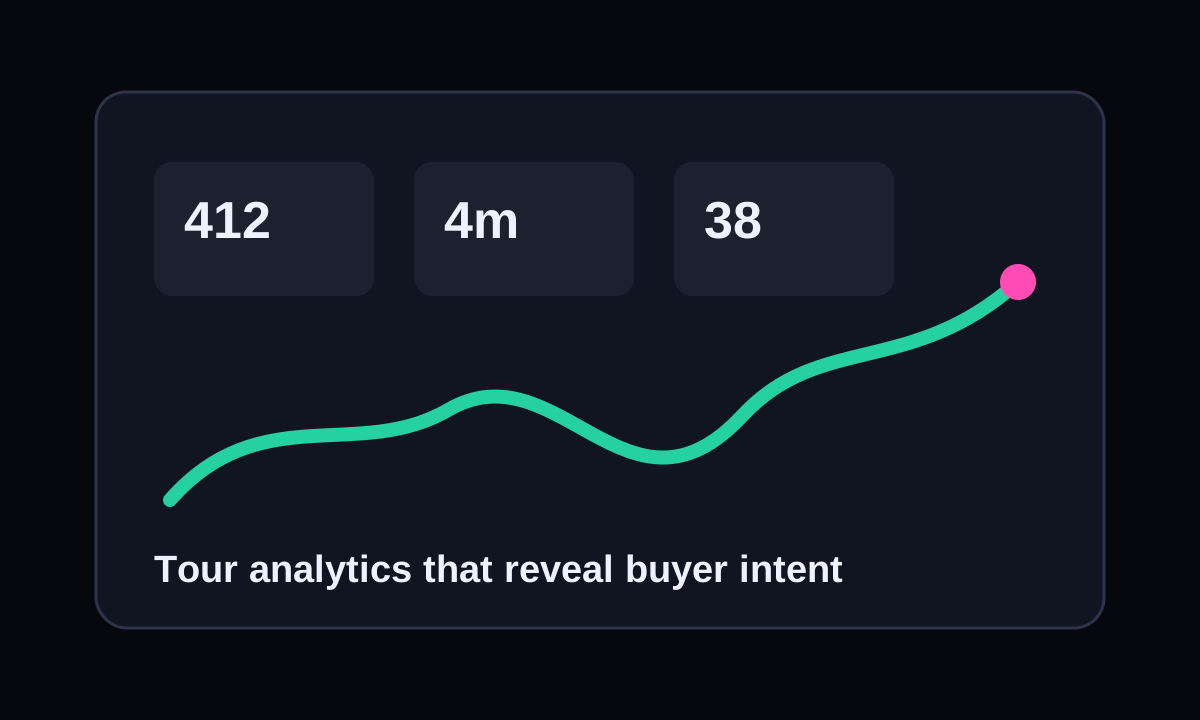
SceneHost analytics help short-let teams move beyond vanity views by tracking room views, guide-module opens, repeat visits, direct-booking clicks, and source patterns.
Why teams choose SceneHost
- Use guide engagement to separate casual curiosity from guests who repeatedly inspect a property before booking.
- Show owners more than impressions by reporting sessions, view time, guide activity, and channel performance.
- Improve room coverage, pricing, copy, and follow-up based on how people actually interact with each guide.
Why tour analytics matter
Most listing analytics stop too early. Page views and portal saves tell you that someone saw the property, but they do not reveal whether the guest understood the layout, returned later, explored deeply, or became confident enough to book. A 360 Guest Guide creates a richer behavior trail because the viewer spends time moving through rooms and opening guide items.
SceneHost treats that behavior as useful marketing intelligence. Sessions, room views, guide opens, booking clicks, and repeat visits can help teams decide which channels deserve priority, which listings need clearer guidance, and which owner updates should include concrete engagement proof. Analytics turn the guide from a nice presentation into a feedback loop.
Metrics worth tracking
The most useful metrics are the ones that connect to action. Total views show reach, but average time on tour suggests depth. Repeat sessions may indicate a household returning to discuss the property. Lead form submissions reveal explicit interest. Channel patterns show whether email, social, MLS, or a brokerage page is sending the most engaged traffic.
SceneHost's analytics surface is designed around those practical signals. A team can review tour sessions, compare published tours, watch processing and visibility status, and connect engagement to leads. The goal is to help agents make better follow-up decisions without forcing them to become data analysts.
Using analytics for follow-up
Tour analytics are most valuable when they change timing and messaging. A viewer who opens the tour once for fifteen seconds may not need immediate outreach. A viewer who returns twice, spends several minutes inside, and submits a question about availability is different. That person has already used the tour to evaluate the property and deserves a faster, more specific response.
Good follow-up references the prospect's likely context without sounding invasive. Instead of saying you watched every move, say that the tour is available for another look, ask whether the layout answers their needs, and offer a showing or leasing call. The data should sharpen service, not make the experience feel monitored.
Seller and owner reporting
Sellers and property owners often judge marketing by visible activity: showings, inquiries, and offers. That leaves a gap during the days when people are researching quietly. Tour analytics fill part of that gap by showing that prospects are spending time with the listing even before they raise a hand.
A weekly update can include tour views, average engagement, repeat visits, lead count, and changes after a price adjustment or new distribution push. This makes the agent or manager look more rigorous and gives the owner a clearer story about market response. If interest is high but leads are weak, the team can revisit pricing, copy, staging, or audience targeting.
Improving the tour itself
Analytics can also reveal content problems. If prospects bounce quickly, the tour may load slowly, start from an unhelpful viewpoint, or fail to answer the first spatial question. If viewers spend time but do not convert, the surrounding page may need clearer calls to action, better property details, or a stronger lead form.
SceneHost connects analytics with the broader publishing workflow so teams can improve each guide over time. Read the analytics guides, compare tour performance, and test distribution changes. The highest-value teams treat 360 guide analytics as part of the listing process rather than a report they glance at after the campaign is over.
Frequently Asked Questions
What analytics should a 360 Guest Guide platform provide?
At minimum, teams should look for sessions, view counts, room views, time on guide, guide-module opens, direct-booking clicks, lead submissions, published guide status, and enough context to compare performance between properties or channels.
Can analytics reduce wasted showings?
Yes. When prospects can explore the property first and teams can see deeper engagement, follow-up can focus on people who have already self-qualified around layout, condition, and interest.
How should I use analytics in seller updates?
Summarize reach and depth: views, average time, repeat sessions, leads, and changes after marketing pushes. Use the numbers to explain what you will adjust next.
Are tour views enough?
Views are useful, but they are incomplete. A smaller number of high-engagement sessions can be more valuable than a large number of shallow clicks.
Where can I learn more?
Read SceneHost's guide analytics resources, advanced metrics article, and ROI guide, then test those ideas on one active listing or rental.
Publish a measurable 360 Guest Guide from your next property.
Start with room panoramas and guest-ready instructions. SceneHost handles hosted guide pages, lightweight embeds, analytics, protected sharing, direct-booking CTAs, and the public URLs your marketing stack needs.
Measure a tour